Overview
A catalog-driven deep-learning pipeline that classifies stars from RGB image cutouts. The model predicts the Morgan–Keenan spectral letter and the subclass digit (0–9 within the predicted letter) from photometric imagery alone. O stars are rare enough that none were in this run's training data, so the letter head reported here resolves six classes: B, A, F, G, K, M.
Inputs are constructed by querying VizieR catalogs for coordinates, magnitudes, colors, and spectral hints, then fetching color cutouts from Pan-STARRS with graceful fallbacks to other surveys. Each cutout is preprocessed to expose color cues without saturating the stellar core, then routed through a multi-task CNN.
Pipeline
Three independent stages: catalog ingestion, image builder, and classifier.
- Catalog ingestion: programmatic queries against Gaia DR3, HIPPARCOS, PS1, and WISE assemble a unified metadata table (coordinates, magnitudes, colors, effective-temperature hints, spectral types where present).
- Image builder: fetches color cutouts, recenters and stretches them, scales toward a magnitude-aware target peak to avoid blown cores, and rejects grayscale or low-quality frames via explicit quality gates.
- Multi-task CNN classifier: three heads (letter, combined letter × subclass, stage) trained jointly. The combined head lets the model learn letter-specific subclass boundaries from a single softmax.
Dataset
The raw class distribution is steeply imbalanced: K and F stars dominate; O and M are rare. The builder applies a "curved" target distribution to soften this skew without throwing away the long tail. The run behind the reported model had no O stars, so the letter metrics below are six-class.
| Letter | Before balancing | After balancing |
|---|---|---|
| K | 30,901 | 26,154 |
| F | 30,117 | 25,754 |
| A | 17,127 | 18,356 |
| G | 12,072 | 14,881 |
| B | 5,537 | 9,322 |
| M | 285 | 1,572 |
| Split | Images |
|---|---|
| Train | 67,227 |
| Validation | 14,406 |
| Test | 14,406 |
Splits total 96,039 rows, the same as the balanced set. Balancing draws the minority letters with replacement before the split, so copies of one image can sit in both train and test: 27.4% of the test images have an identical copy in training (M 97.9%, B 66.8%, G 58.7%, A 53.3%; F and K, only downsampled, none). The unseen-star check under Results measures how far the headline holds.
Quality gates
- Minimum peak intensity and peak-to-background ratio.
- Maximum centroid offset from frame center.
- Maximum fraction of saturated pixels.
- Grayscale detection: RGB channels must carry independent information.
Model architecture
A compact, regularized four-block ConvNet with three jointly-trained heads.
Four Conv → BatchNorm → ReLU blocks (32 → 64 → 128 → 256 channels) feed global average pooling and a shared dense layer. Three softmax heads sit on top:
- Letter head: softmax over the present spectral letters.
-
Combined head: softmax over
letter × 10 + subclass, letting the model learn letter-specific subclass boundaries from a single classifier. - Stage head: auxiliary softmax over evolutionary stage. It never trained in this run: the image bundle carries no stage labels, so its loss weight stayed at zero. It is not reported below.
Training
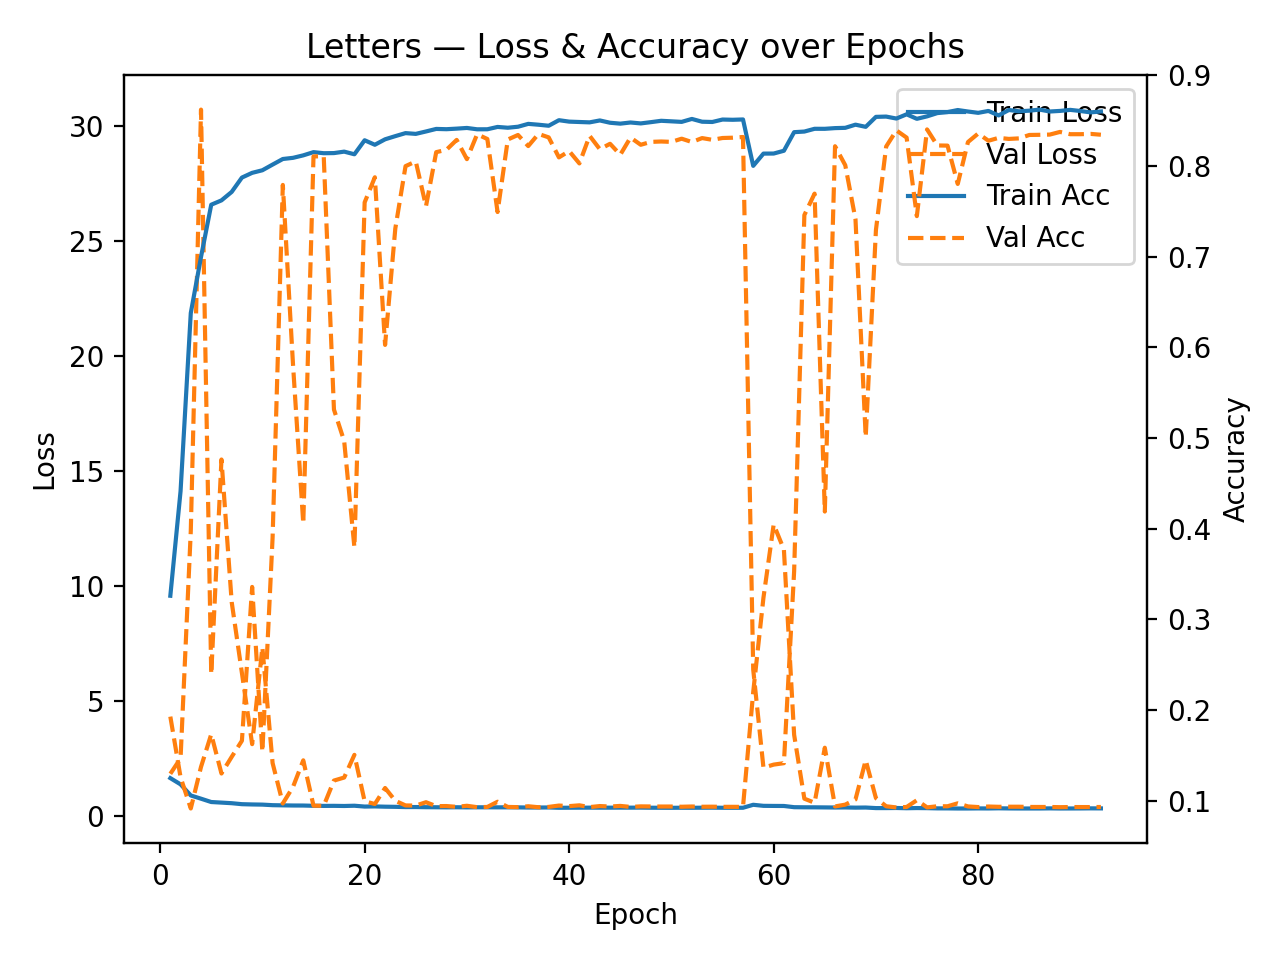
Two-stage. Stage 1 trains the whole network on the letter loss alone to establish a stable backbone. Stage 2 adds the combined-head loss at equal weight and a lower learning rate; nothing is frozen in either stage. Class balance is handled by curved resampling plus class-balanced sample weights. The 70 / 15 / 15 split is stratified on letter. Plateau-triggered LR reductions and early stopping with best-weight restoration guard against overfitting.
Results
The letter head is the headline number: it tracks the macroscopic temperature sequence robustly. Subclass resolution is harder because RGB cutouts encode color differences only coarsely.
Because 27.4% of the test set has a copy in training, the model was also scored on 17,672 stars from a separate bundle that it never saw. On the 6,944 A, B, F and G stars among them, as bright as the training data, it gets 82.3% top-1, so for that population the headline roughly holds. That bundle's K and M stars are more than ten magnitudes fainter than the training stars, and the model mostly calls them G: it has not learned faint stars.
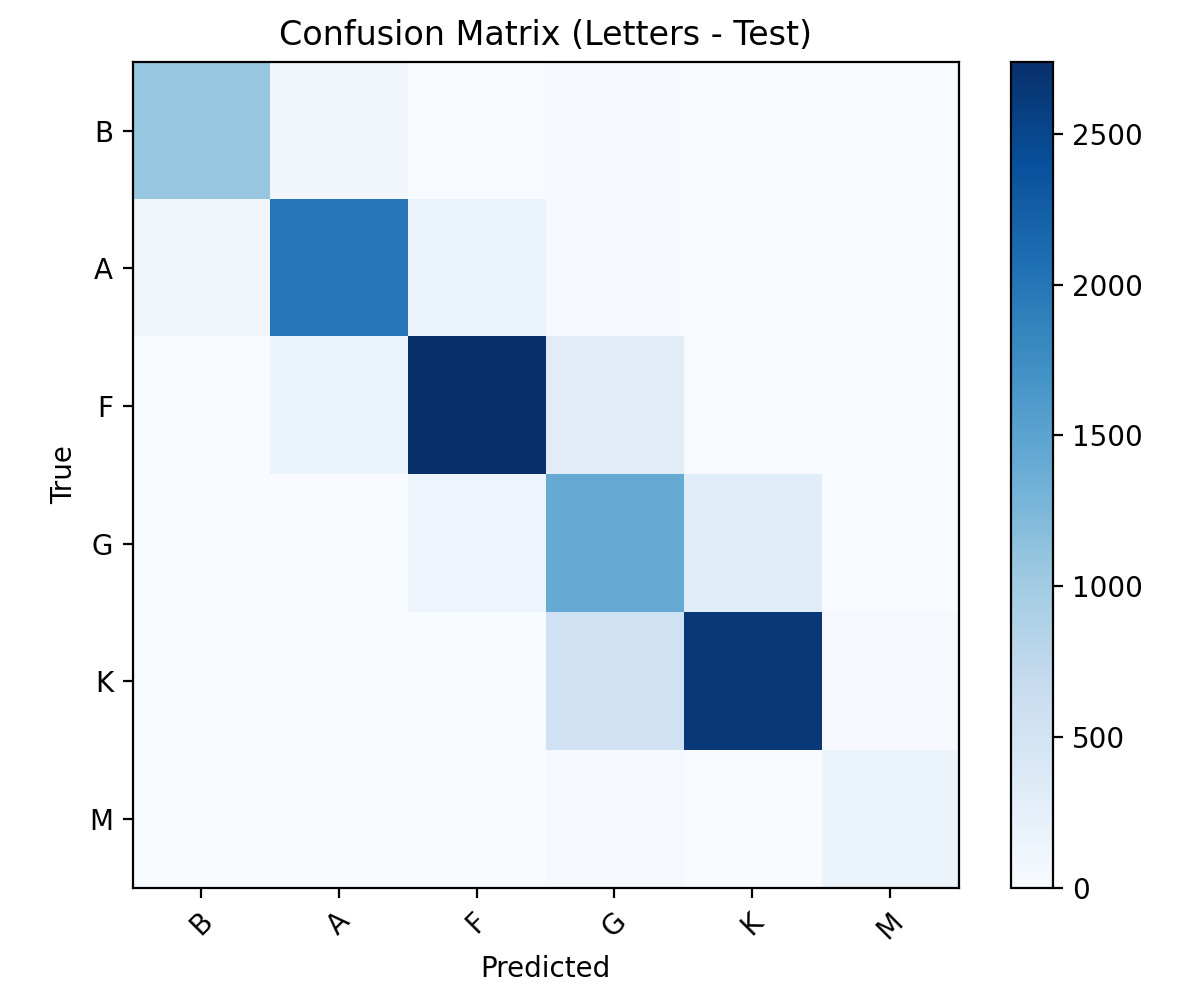
- 84.3% Letter top-1 6-class softmax (B, A, F, G, K, M)
- 98.4% Letter top-2 Adjacent-letter confusion is common but bounded
- 0.846 Letter macro F1 Precision 0.847 / Recall 0.848
- 82.3% Letter top-1, unseen stars 6,944 bright A/B/F/G stars from a separate bundle
- 30.6% Subclass overall 10-way digit prediction; top-2: 51.5%
- 30.2% Combined exact Exact letter + digit match
Letter confusion matrix
Test set letter-head confusion across the six spectral classes the model resolves. The diagonal dominates as expected; what little off-diagonal mass exists is concentrated on adjacent letters in the temperature sequence.
Error analysis
Confusion concentrates at decision boundaries that are physically adjacent: the model is learning a smooth temperature sequence rather than memorizing class identities.
- Letter confusion is dominated by A/F, F/G, and G/K pairs, neighboring colors in the H–R diagram.
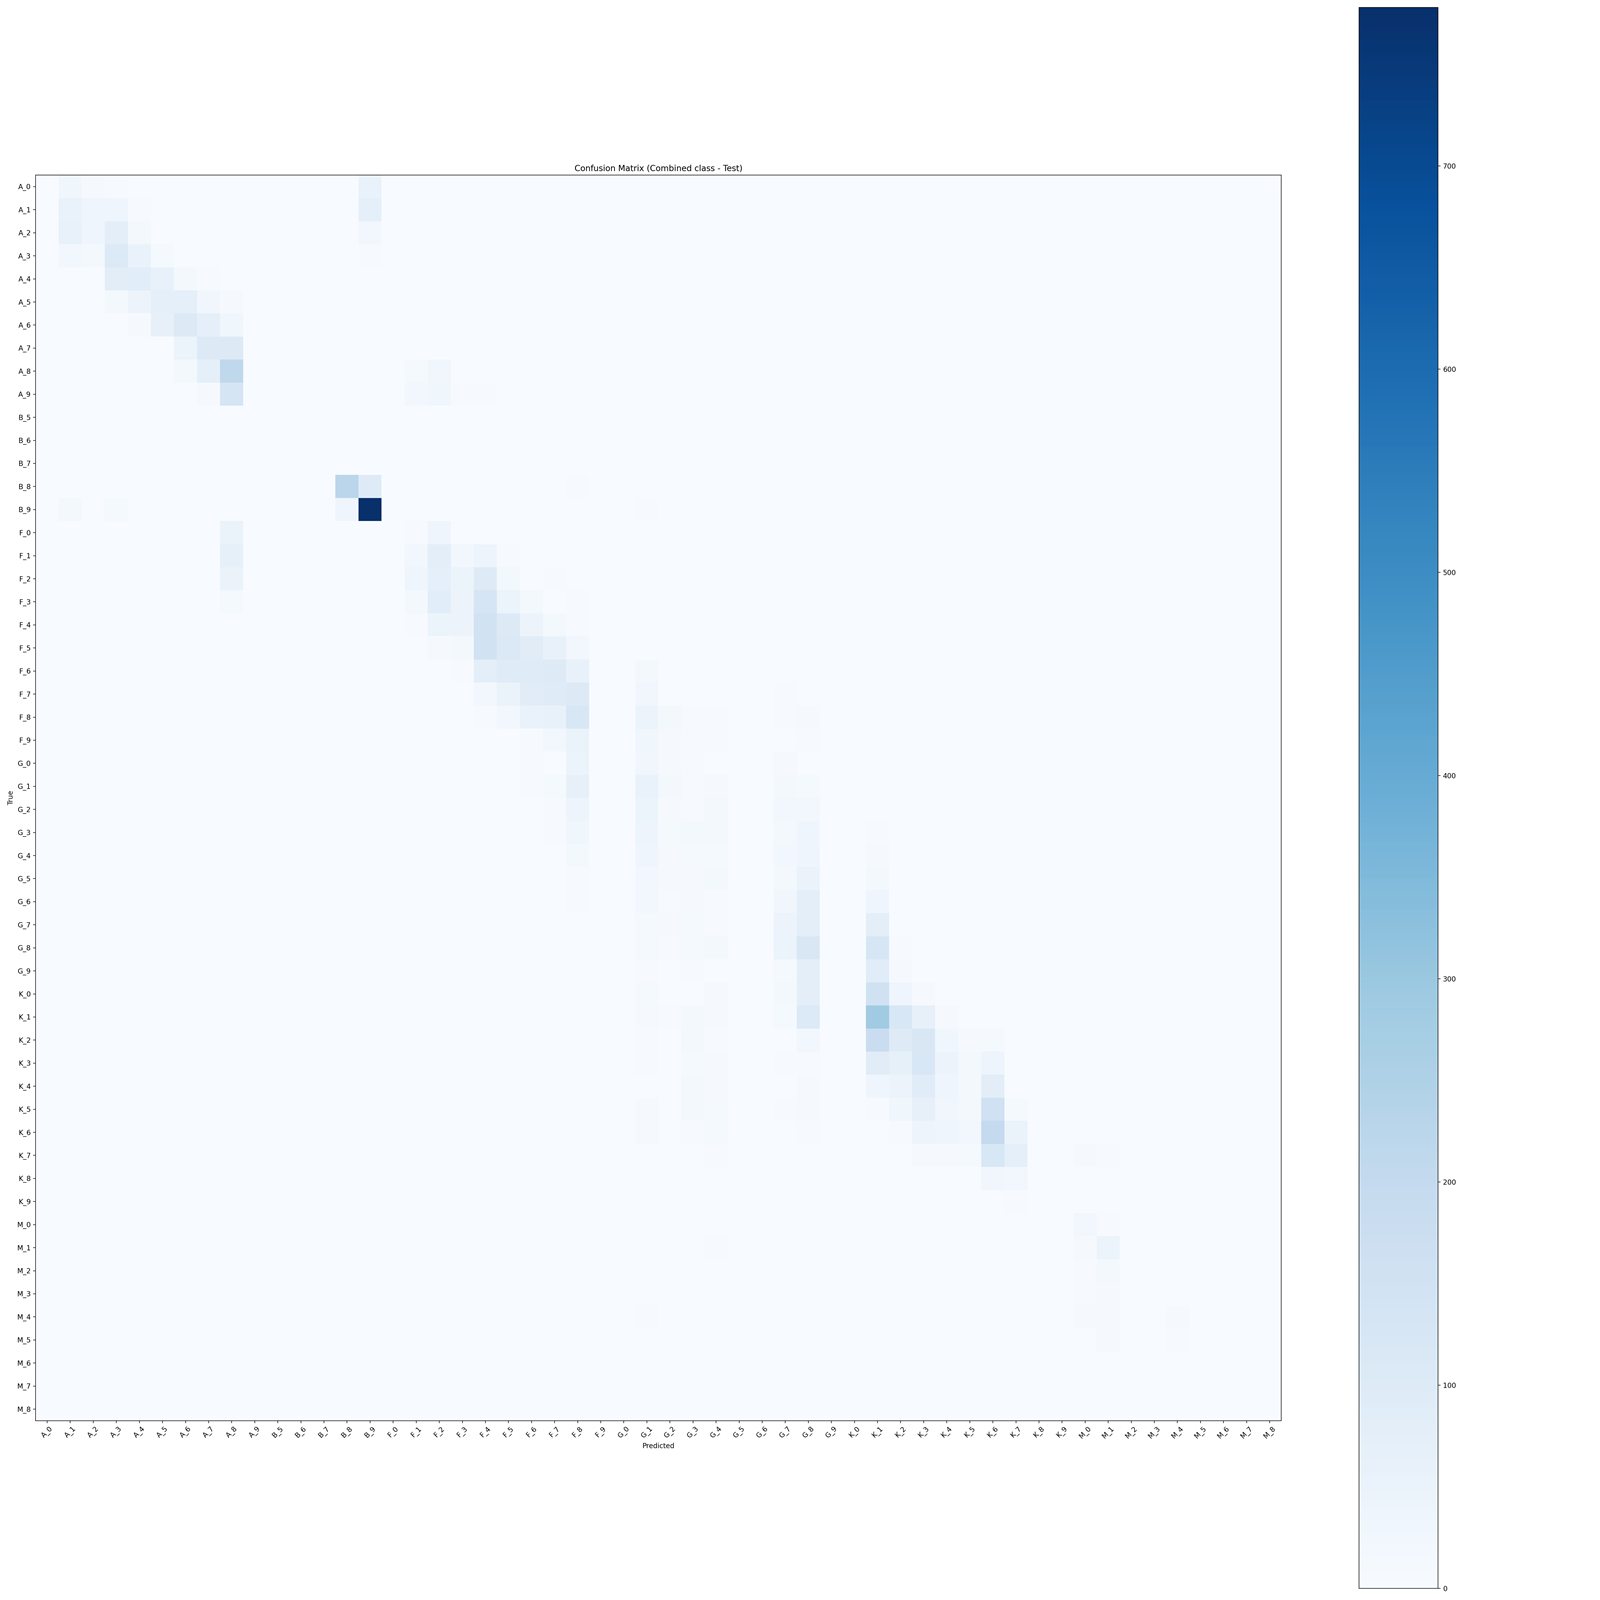
- Subclass errors are locally smooth: typically off by ±1 subclass. Large jumps occur primarily where the underlying subclass has few training examples.
- Combined accuracy tracks letter accuracy: when the letter is right, subclass resolution is competitive; misclassified letters drag the combined number down by construction.
Inference program
The inference script loads the trained model, reads a star image or a folder of them, applies the same
preprocessing as training, and prints a letter + subclass prediction for each (e.g. G2), with the
catalogue answer alongside when a bundle's metadata is supplied.
Limitations & future work
- RGB-only inputs: spectral subclass boundaries are intrinsically fuzzy in three-band photometry and are confused further by interstellar reddening.
- Saturation & centring: performance is sensitive to data hygiene; quality gates exist, but borderline frames still leak through.
- Rare classes: O is absent from this run and M is limited by raw availability even after balancing. Targeted sampling or modest augmentation would help, provided the resampling happens after the split.
- Next directions: calibrated photometry, extinction estimates, NIR bands, and attention pooling over radial profiles are the most promising routes to sharper subclass resolution.
Links
The source code, the image dataset, and the full technical writeup.